Integration of caliper analysis with borehole stress
Once you have the interpretation of breakouts from the Caliper Analysis, you can visualize breakout positions from caliper analysis on the geomechanical model from the borehole stress analysis. The breakout positions from caliper analysis can be displayed for borehole stress analysis from the elasticity calculations At The Wall and Around The Hole (Advanced Stress and Failure > Borehole Stress).
![]() Displaying breakout position on the Elasticity At The Wall view
Displaying breakout position on the Elasticity At The Wall view
To display the breakout position on the Elasticity At The Wall view, open the Display settings and Inputs pane using the Options ![]() button from the toolbar. In the display settings tab, check the checkbox adjacent to the Breakout Position (from Caliper). The breakout position(s) are displayed with a dashed red line in the borehole image at the same depth as interpreted in the caliper analysis. You can also change the input for MD window ± for the Caliper data which refers to the deviation of the breakout position.
button from the toolbar. In the display settings tab, check the checkbox adjacent to the Breakout Position (from Caliper). The breakout position(s) are displayed with a dashed red line in the borehole image at the same depth as interpreted in the caliper analysis. You can also change the input for MD window ± for the Caliper data which refers to the deviation of the breakout position.
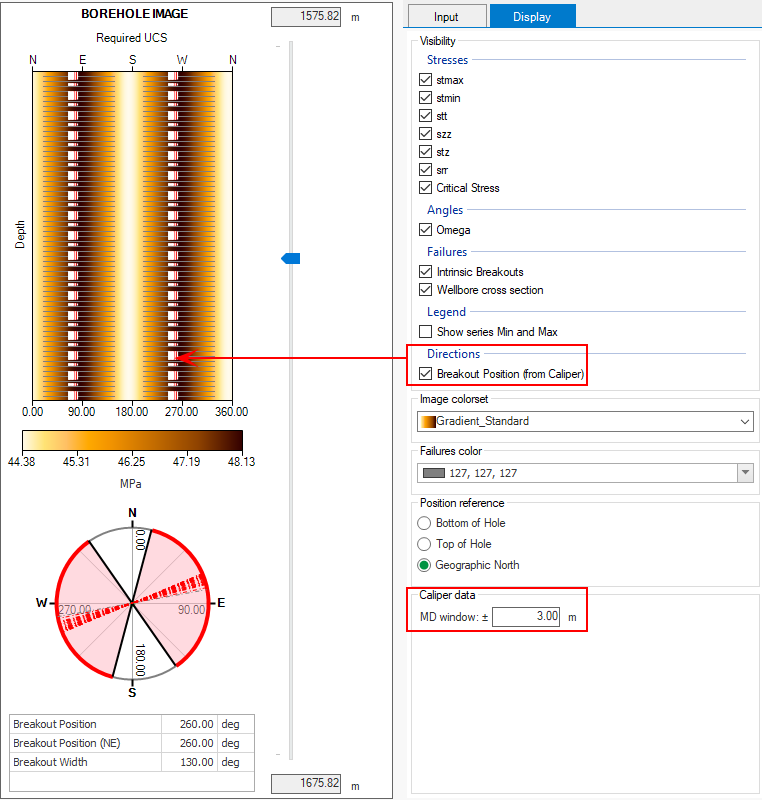
Example showing the breakout position from Caliper Analysis on the Elasticity At The Wall view. click to enlarge
![]() Displaying breakout position on the Elasticity Around The Hole view
Displaying breakout position on the Elasticity Around The Hole view
To display the breakout position on the Elasticity Around The Hole view, open the Display settings and Inputs pane using the Options ![]() button from the toolbar. In the display settings tab, check the checkbox adjacent to the Breakout Position (from Caliper) in the visibility section. Make sure the UCS profile displayed on the view has the same depth range as the caliper analysis. The breakout position(s) are displayed with red arrows over the cross section of the borehole image and can be compared with the direction of maximum compression which is displayed with blue arrows. You can also change the input for MD window ± for the Caliper data which refers to the deviation of the breakout position.
button from the toolbar. In the display settings tab, check the checkbox adjacent to the Breakout Position (from Caliper) in the visibility section. Make sure the UCS profile displayed on the view has the same depth range as the caliper analysis. The breakout position(s) are displayed with red arrows over the cross section of the borehole image and can be compared with the direction of maximum compression which is displayed with blue arrows. You can also change the input for MD window ± for the Caliper data which refers to the deviation of the breakout position.
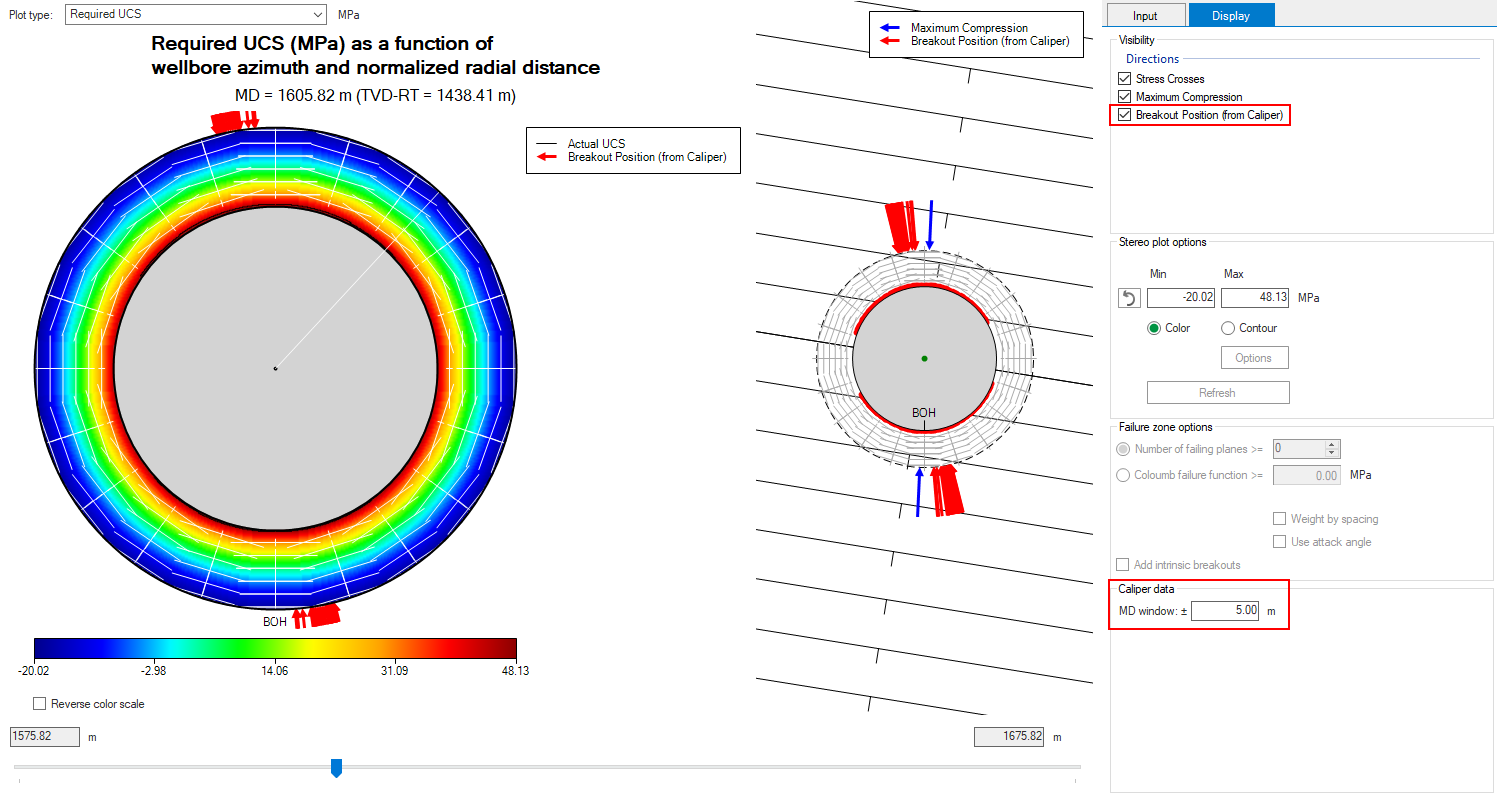
Example showing the breakout position from Caliper Analysis on the Elasticity Around The Hole view. click to enlarge